01.31.19
DowDuPont announced its fourth quarter and full year 2018 financial highlights.
For the fourth quarter of 2018, GAAP earnings per share from continuing operations totaled $0.21. Adjusted earnings per share increased 6% to $0.88, compared with the year-ago period of $0.83. Adjusted earnings per share excludes significant items in the quarter totaling net charges of $0.56 per share and an $0.11 per share charge for DuPont amortization of intangible assets.
Net sales were even with the year-ago period at $20.1 billion, as price and volume gains were offset by currency. GAAP net income from continuing operations totaled $513 million. Operating EBITDA was $3.9 billion, flat with the year-ago period, as cost synergies and local price gains were offset by margin compression in the Materials Science Division, lower equity earnings and a headwind from currency.
DowDuPont achieved cost synergy savings of more than $500 million in the quarter, and since merger close has now delivered more than $1.8 billion of cumulative savings.
Cash flow from operations in the quarter was $5.1 billion compared to $1.8 billion in the year-ago period. After adjusting for the accounting and presentation change for accounts receivable securitization, cash flow from operations rose $0.9 billion year-over-year.
“In our first full year as a merged company, we delivered consistently strong results. Pro forma sales rose 8% with gains in every geography. We delivered a 13% increase in operating EBITDA. And we raised our cost synergy expectation by 20% to $3.6 billion, while continuing to return significant capital to shareholders,” said Ed Breen, CEO of DowDuPont.
“We remain on track for the separation of the new Dow on April 1, followed by Corteva from the new DuPont on June 1. We are excited about launching these three global companies, each set to be an industry leader with the right capital structure and now better positioned to serve customers, compete in their end markets and focus on their innovation priorities,” Breen added.
For full-year 2018, GAAP earnings per share from continuing operations totaled $1.65. Adjusted earnings per share was $4.11, up 21% versus pro forma results in the year-ago period. Adjusted earnings per share excludes significant items totaling net charges of $2.02 per share, as well as a $0.44 per share charge for DuPont amortization of intangible assets.
GAAP net sales increased 38%. Net sales increased 8% to $86.0 billion versus pro forma results in the year-ago period, with gains in all regions. GAAP net income from continuing operations totaled $4.0 billion. Operating EBITDA increased 13% to $18.3 billion versus pro forma results in the year-ago period, as cost synergies; local price gains; volume growth, including the benefit of new capacity additions; lower pension/OPEB costs; and higher equity earnings more than offset higher raw material costs.
Cash flow from operations totaled $4.7 billion and included discretionary pension contributions of approximately $2.2 billion. Excluding these discretionary contributions, cash flow from operations would have been $6.9 billion.
Materials Science net sales decreased 1% to $11.8 billion, as volume growth of 1% was more than offset by local price and currency, each down 1%. Operating EBITDA decreased 12% to $2.1 billion, driven by margin compression in isocyanates and polyethylene products and lower equity earnings.
Full-year sales increased 11% on a pro forma basis, with local price and volume gains in all regions. Operating EBITDA grew 10% on a pro forma basis, with gains in all segments, driven by local price and volume gains, including contributions from new capacity on the U.S. Gulf Coast; cost synergies; and higher equity earnings.
Performance Materials & Coatings reported net sales of $2.2 billion, down 1% from the year-ago period. Sales increases in most regions were more than offset by a decline in Asia Pacific. Local price increased 7%, with gains in all regions. Volume declined 6%, with decreases in both businesses and all regions. Currency decreased sales 2% versus the year-ago period.
Consumer Solutions and Coatings & Performance Monomers both reported modest sales declines on lower volume and unfavorable impacts from currency, which more than offset price gains in all regions. Consumer Solutions continued to capture price gains, while volume declined primarily due to proactive measures to improve product and business mix. Coatings & Performance Monomers sales declined as price increases in most regions were more than offset by lower demand and a headwind from currency. Operating EBITDA increased to $421 million, up 5% from $400 million in the year-ago period.
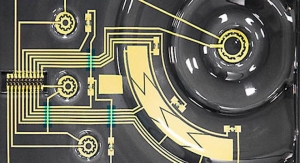
Electronics & Imaging reported net sales of $1.2 billion, down 2% from the year-ago period as volume growth of 1% was offset by a 2% decline in local price and a 1% currency headwind.
Volume growth in the segment was led by continued strength in semiconductor technologies on strong demand in chemical mechanical planarization (CMP) and advanced packaging end-markets as well as double-digit gains in display technologies. These gains were partially offset by volume declines in interconnect solutions due to weaker smartphone sales and continued softness in the photovoltaics market. Volume gains in US and Canada and Asia Pacific were offset by declines in EMEA. Operating EBITDA for the segment was $685 million, an increase of 18% from $581 million in the year-ago period.
For the fourth quarter of 2018, GAAP earnings per share from continuing operations totaled $0.21. Adjusted earnings per share increased 6% to $0.88, compared with the year-ago period of $0.83. Adjusted earnings per share excludes significant items in the quarter totaling net charges of $0.56 per share and an $0.11 per share charge for DuPont amortization of intangible assets.
Net sales were even with the year-ago period at $20.1 billion, as price and volume gains were offset by currency. GAAP net income from continuing operations totaled $513 million. Operating EBITDA was $3.9 billion, flat with the year-ago period, as cost synergies and local price gains were offset by margin compression in the Materials Science Division, lower equity earnings and a headwind from currency.
DowDuPont achieved cost synergy savings of more than $500 million in the quarter, and since merger close has now delivered more than $1.8 billion of cumulative savings.
Cash flow from operations in the quarter was $5.1 billion compared to $1.8 billion in the year-ago period. After adjusting for the accounting and presentation change for accounts receivable securitization, cash flow from operations rose $0.9 billion year-over-year.
“In our first full year as a merged company, we delivered consistently strong results. Pro forma sales rose 8% with gains in every geography. We delivered a 13% increase in operating EBITDA. And we raised our cost synergy expectation by 20% to $3.6 billion, while continuing to return significant capital to shareholders,” said Ed Breen, CEO of DowDuPont.
“We remain on track for the separation of the new Dow on April 1, followed by Corteva from the new DuPont on June 1. We are excited about launching these three global companies, each set to be an industry leader with the right capital structure and now better positioned to serve customers, compete in their end markets and focus on their innovation priorities,” Breen added.
For full-year 2018, GAAP earnings per share from continuing operations totaled $1.65. Adjusted earnings per share was $4.11, up 21% versus pro forma results in the year-ago period. Adjusted earnings per share excludes significant items totaling net charges of $2.02 per share, as well as a $0.44 per share charge for DuPont amortization of intangible assets.
GAAP net sales increased 38%. Net sales increased 8% to $86.0 billion versus pro forma results in the year-ago period, with gains in all regions. GAAP net income from continuing operations totaled $4.0 billion. Operating EBITDA increased 13% to $18.3 billion versus pro forma results in the year-ago period, as cost synergies; local price gains; volume growth, including the benefit of new capacity additions; lower pension/OPEB costs; and higher equity earnings more than offset higher raw material costs.
Cash flow from operations totaled $4.7 billion and included discretionary pension contributions of approximately $2.2 billion. Excluding these discretionary contributions, cash flow from operations would have been $6.9 billion.
Materials Science net sales decreased 1% to $11.8 billion, as volume growth of 1% was more than offset by local price and currency, each down 1%. Operating EBITDA decreased 12% to $2.1 billion, driven by margin compression in isocyanates and polyethylene products and lower equity earnings.
Full-year sales increased 11% on a pro forma basis, with local price and volume gains in all regions. Operating EBITDA grew 10% on a pro forma basis, with gains in all segments, driven by local price and volume gains, including contributions from new capacity on the U.S. Gulf Coast; cost synergies; and higher equity earnings.
Performance Materials & Coatings reported net sales of $2.2 billion, down 1% from the year-ago period. Sales increases in most regions were more than offset by a decline in Asia Pacific. Local price increased 7%, with gains in all regions. Volume declined 6%, with decreases in both businesses and all regions. Currency decreased sales 2% versus the year-ago period.
Consumer Solutions and Coatings & Performance Monomers both reported modest sales declines on lower volume and unfavorable impacts from currency, which more than offset price gains in all regions. Consumer Solutions continued to capture price gains, while volume declined primarily due to proactive measures to improve product and business mix. Coatings & Performance Monomers sales declined as price increases in most regions were more than offset by lower demand and a headwind from currency. Operating EBITDA increased to $421 million, up 5% from $400 million in the year-ago period.
Electronics & Imaging reported net sales of $1.2 billion, down 2% from the year-ago period as volume growth of 1% was offset by a 2% decline in local price and a 1% currency headwind.
Volume growth in the segment was led by continued strength in semiconductor technologies on strong demand in chemical mechanical planarization (CMP) and advanced packaging end-markets as well as double-digit gains in display technologies. These gains were partially offset by volume declines in interconnect solutions due to weaker smartphone sales and continued softness in the photovoltaics market. Volume gains in US and Canada and Asia Pacific were offset by declines in EMEA. Operating EBITDA for the segment was $685 million, an increase of 18% from $581 million in the year-ago period.